Principles of Sample Size Calculation
Completion requirements
View
2. Why Sample Size is Important?
2.2. How To Calculate the Sample Size for Randomised Controlled Trials
Formulas for sample size calculation differ depending on the type of study design and the studies outcome(s). These calculations are particularly of interest in the design of randomised controlled trials (RCTs). In general, sample size calculations are
performed based on the primary outcome of the study.
An example of how to calculate sample size using the simplest formulas for an RCT comparing two groups of equal size is given in the following.
Suppose one wished to study the effect of a new hypertensive medicine on systolic blood pressure (SBP) (measured in mmHg) as a continuous outcome.
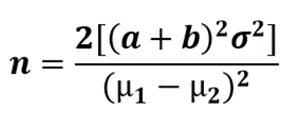
The simplest formula for a continuous outcome and equal sample sizes in both groups, assuming: α = 0.05 and power = 0.80 (β = 0.20, therefore 1-β=0.8).

n = the sample size in each of the groups
μ1 − μ2 = the difference the investigator wishes to detect
σ2 = population variance (SD)
a = conventional multiplier for alpha* when alpha is 0.05
b = conventional multiplier for power* when beta is 0.80
When the significance level alpha is chosen at 0.05, one should enter the value 1.96 for a in the formula. Similarly, when beta is chosen at 0.20, the value 0.842 should be filled in for b in the formula.
Suppose the investigators consider a difference in SBP of 15 mmHg between the treated and the control group (μ1 – μ2) as clinically relevant, and specified that such an effect should be detected with 80% power (0.80) and a significance level alpha of
0.05. Past experience with similar experiments, with similar measuring methods, and with similar subjects, suggests that the data will be approximately normally distributed with an SD of 20 mmHg. Now we have all of the specifications needed for determining
sample size using the approach as summarized in the formula above.
Entering the values in the formula yields:

This means that a sample size of 28 subjects per group is needed to answer the research question.
*These values are looked up in a statistical table by the researchers. The table values are based on the normal distribution of these errors.