1. Why measure Health-Related Quality of Life?
1.2. Calculation of QALYs
QALYs can be calculated using the following formula which assumes a utility value designated by a score (quality of life) between 1 = perfect health and 0 = dead:
Years of Life x Utility Value = Number of QALYs
This will yield:
- If a person lives in perfect health for one
year, that person will have 1 QALY.
(1 Year of Life × 1 Utility Value = 1 QALY) - If a person lives in perfect health but only for
half a year, that person will have 0.5 QALYs.
(0.5 Years of Life x 1 Utility Value = 0.5 QALYs) -
Conversely, if a person lives for 1 year in a
situation with 0.5 utility (half of perfect health), that person will also have
0.5 QALYs.
(1 Year of Life x 0.5 Utility Value = 0.5 QALYs)
QALY calculations can be used to visualise the relationship between the quality and quantity of life experienced with and without the therapy in question, as in the graph below.
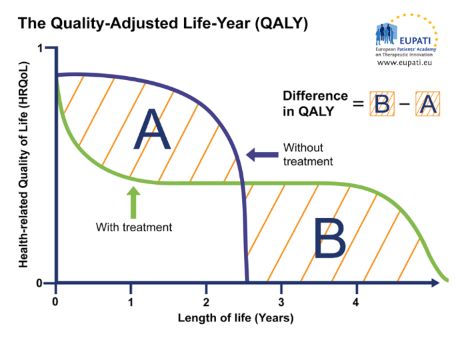
Figure 1: The Quality-Adjusted Life Year (QALY)
Similar graphs can be used to plot changes in HRQoL over time with and without treatment, providing a visualisation of the QALY gain or loss, respectively. In the graph below, for instance, the treatment provides an increase in HRQoL as well as an extension of life, resulting in a net QALY gain.
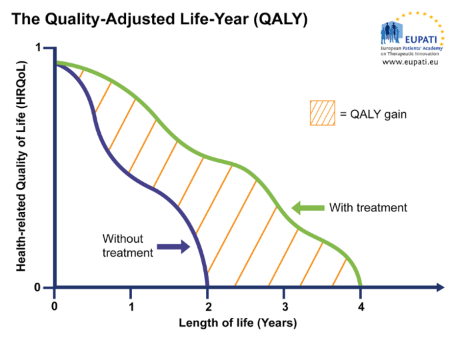
Figure 2: The Quality-Adjusted Life Year (QALY)
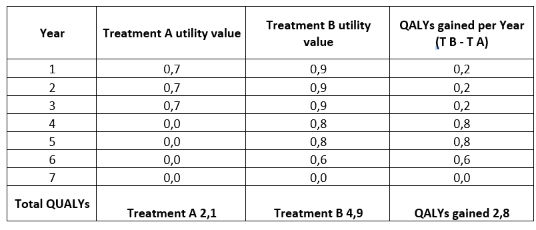
The following graph summarises the essentials of a QUALY calculation for a fictive comparison of two treatments.
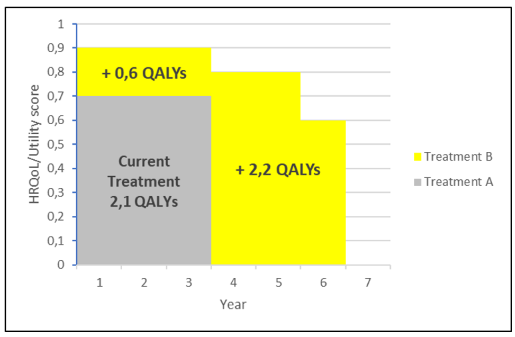
Figure 3: a QUALY calculation for a fictive comparison of
two treatments.
-> If a person lives for 3 years
with a disease and the current treatment (treatment A) for that disease with a
utility score of 0.7, that person will have 2.1 QALYs.
(3 Years of Life x 0.7 Utility
Value = 2.1 QALYs)
--> If that person receives a new
treatment (treatment B) whereby his/her utility score increases to 0.9, that
person will now have 2.7 QALYS during the initial 3 years, i.e., the benefit of
the new treatment will add 0.6 QALYs as this is the increase over the current treatment.
(3 Years of Life x 0.2
Additional Utility Value = 0.6 additional QALYs)
---->Thus the overall gain attributable to the new treatment will be 0.6 + 2.2 = 2.8 QALYs
Table 2: Illustration of the scores used in the above graph