2. Genomics
2.4. Gene Expression as a Biomarker
DNA sequencing will tell you about the genetic variants that individual persons have. But it is also important to know which genes are being ‘expressed’, or switched on, and how strongly. When genes are expressed, they are first transcribed into mRNA. They are then translated into proteins. See introduction to this section 'Overview of techniques involved'.
mRNA molecules are made up of a single strand of bases (unlike DNA which is a double strand). Levels of mRNA can be measured to give a gene expression signature. The whole set of mRNA molecules in a cell at any one time is sometimes referred to as the transcriptome. Transcriptomics is used to learn more about how genes are turned on in different types of cells.
Gene expression signatures can vary over time and between different tissues and different parts of the body.
For example, a recent study into advanced ovarian cancer has shown that it is possible to separate patients into those who respond well to platinum chemotherapy and those who do not. This is shown by looking at how genes are expressed differently in their tumours.
Platinum chemotherapy has several common serious side effects. If a doctor knows how likely a patient is to respond, it helps the doctor and the patient assess if it is worth risking these side effects.
How gene expression is measured
Microarray technology is used to identify gene expression signatures. mRNA molecules are collected and converted into artificial molecules called ‘complementary DNA’ (cDNA). cDNA is much more stable and easier to work with than mRNA. The cDNA molecules are then put on a glass slide that has thousands of DNA sequences already bound to it. The cDNA will stick if a cDNA sequence matches a bound piece of DNA.
The result is a microarray. This is a pattern of fluorescent (lit up) dots of different colours on the slide. The colours show how strongly different genes in the sample are expressed compared to another sample which is used as a ‘control’. For example, you may compare a cancer cell sample to a normal cell from the same person which would then work as a control. One colour means high levels of expression, while a second colour means low levels. Another will indicate the same level of expression between the sample and control.
Computers are used to measure and analyse the fluorescence pattern.
Gene expression profile
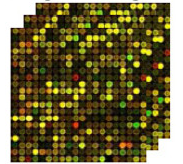
Figure 5: Gene expression profile measured with microarray technology. Taken from http://www.biomedcentral.com/content/pdf/1752-0509-5-161.pdf
NGS technology (described in section 2.2) can also be used to measure mRNA. It is therefore also used in gene expression studies. Compared to microarrays, it is able to detect more subtle changes in gene expression, which might be important in disease processes.