2. Calculating prevalence
Usually, the first question about a certain health event will be: How many people are affected? Or what is the prevalence?
Depending on the population we are looking at, the answer will differ. As an example, look at the following table which will show that the raw number of cases of a health event alone will have only limited value.
Let’s say that there are 10,000 cases of a health event in county A and 20,000 cases in county B. Could we state that the health problem is far more serious in county B? Let’s have a look on the table:
|
|
County A |
County B |
|
Persons affected by a certain health event |
10.000 |
20.000 |
|
Total population of the county |
20.000 |
200.000 |
In county A, a total of 10,000 out of a population of 20,000 are affected, which means that 50% are affected by the health event.
In county B, a total of 20,000 out of a population of 200,000 are affected, which means that 10% are affected by the health event.
The underlying equation to calculate this (the prevalence) would be:
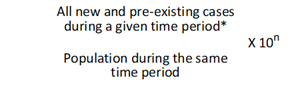
* for point prevalence replace “during a given time period” with “at a particular point in time”
The value of 10n is usually 100 [102], giving a percentage (in general used for common attributes). The value of 10n might be 1,000 [103], 100,000 [10
5], or even larger for rare characteristics and for most diseases.
While our first impression would be that 20,000 are twice as many as 10,000 (which is definitely true!), we now arrive at a very different picture, as we include the population in the equation. In fact, the health problem now looks to be much more severe in the county where in absolute numbers much fewer people are affected.
Rather than as a percentage, we can describe prevalence as the number of people affected in a standard sized population, for example 1,000 people. So, for the above, instead of using 100, which gives the percentage, we could calculate:
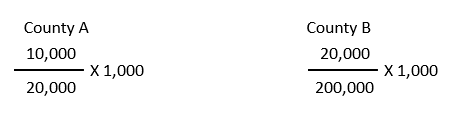
The calculation tells, that in country A 500 in 1,000 people would be affected. In country B 100 in 1,000 people would be affected. Here the denominator is 1,000. Usually, in standard reports the denominator is 100,000.
Consequently, the concept of prevalence is that prevalence is a measure of the proportion of the population that has a given disease, condition, or characteristic at a given time.
The following example, adapted from the Boston University School of Public Health [1] illustrates the concept of period prevalence further:
Suppose that residents of Framingham, MA were examined to establish the proportion of the population that had cataracts. In 1980 the Framingham Heart Study examined 2,477 subjects for cataracts and found that 310 had them. So, the prevalence was 310/2,477 = 0.125.
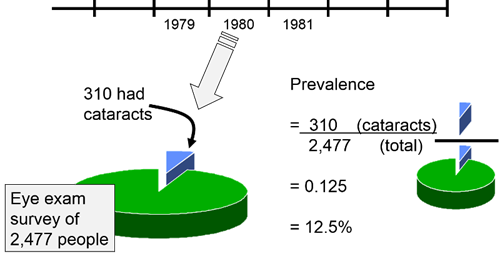
This can be expressed as 12.5 per 100 or 12.5% (per cent means 'per hundred'). Since the examination of these persons took place over a year, it might be referred to as a period prevalence. The prevalence over this observation period would include people who had acquired cataracts previously, and it would also include new cases, i.e., those who had developed cataracts during the year period when the eye exams were conducted. Note that all people counted in the numerator are also included in the denominator, i.e., the numerator is a subset of the denominator.
[1] Course: Measures of Disease Frequency, Wayne W. LaMorte, MD, PhD, MPH, Boston School of Public health https://sphweb.bumc.bu.edu/otlt/mph-modules/ep/ep713_diseasefrequency/EP713_DiseaseFrequency3.html