7. Confidence Interval

The ‘confidence interval’ is used to express the degree of uncertainty associated with a sample statistic. This means that the researcher can only estimate the parameters (i.e. characteristics) of a population, the estimated range being calculated from a given set of sample data.

The confidence interval then is a calculated range of valuesthat is likely to include the population parameter (variable) of interest [in our case, the measure of treatment effect] with a certain degree of confidence. It is often expressed as a % whereby a population parameter lies between an upper and lower set value (the confidence limits).

The likelihood (probability) that the confidence interval will contain the population parameter is called the confidence level. One can calculate a CI for any confidence level, but the most commonly used values are 95% or 99%. A 95% (or 99%) confidence interval will give the range of values (upper and lower) that one can be 95% (or 99%) certain contains the true population mean for the measured effect (the variable of interest) in the sample investigated.

In other words, the confidence interval provides a range for a best guess of the size of the true treatment effect that is plausible given the size of the difference actually observed.

The narrower the confidence interval (upper and lower values), the more precise is our estimate. As a general rule, as the sample size increases, the confidence interval should become narrower. Therefore, with large samples, you can estimate the population mean for the measured effect (the variable of interest) with more precision than you can with smaller samples, so the confidence interval is quite narrow when computed from a large sample. The following figure illustrates this effect.

confidence level

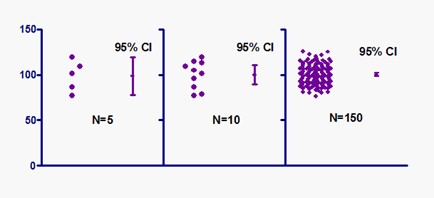
Figure 1: Effect of increased sample size on precision of confidence interval (source https://www.simplypsychology.org/confidence-interval.html)

Confidence intervals (CI) provide different information from what arises from hypothesis tests. Hypothesis testing produces a decision about any observed difference: either that it is ‘statistically significant’ or that it is ‘statistically nonsignificant’. In contrast, confidence intervals provide a range about the observed effect size. This range is constructed in such a way as to determine how likely it is to capture the true – but unknown – effect size.

The following graphs exemplify how the confidence interval can give information on whether or not statistical significance for an observation has been reached, similar to a hypothesis test:

superiority study

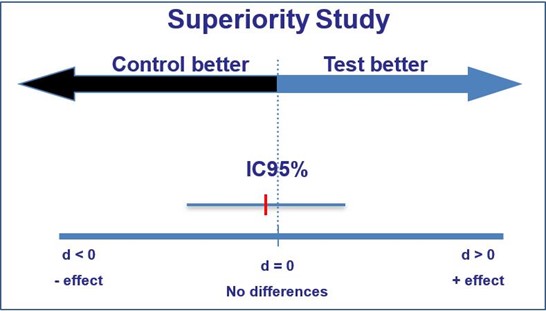
If the confidence interval captures the value reflecting ‘no effect’, this represents a difference that is statistically non- significant (for a 95% confidence interval, this is non-significance at the 5% level).

superiority sutyd 2

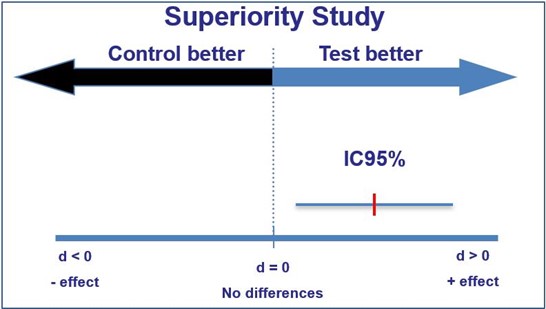
If the confidence interval does not enclose the value reflecting ‘no effect’, this represents a difference that is statistically significant (again, for a 95% confidence interval, this is significance at the 5% level).

In addition to providing an indication of ’statistical significance’, confidence intervals show the largest and smallest effects that are likely, given the observed data, and thus provide additional useful information.