4. Example: SCORE
- His blood pressure is 160/90 (mm Hg) - a normal range of blood pressure is 90/60 to 140/90 (mm Hg).
- His cholesterol level is 8 (mM/L) - a normal cholesterol level is less than 5.2 (mM/L).
By applying these data to the SCORE chart (see Figure 1) it turns out that his risk of getting a fatal CVD is 3% over a 10 year period. Suppose this man does not change his habits and continues with the same lifestyle pattern. It can be projected that at an age of 60 his risk for having a fatal CVD has increased dramatically to 24%. In other words, 24 out of 100 people with this risk will die.
Based on these findings the doctor and the 40-year-old man should agree preventative actions to improve his health status, such as:
- Dietary advice
- Plan for physical activity
- Help to stop smoking and
- Prescription of medicines.
Let us say they agree on a plan and the 40-year-old man follows this. He changes his lifestyle and comes back at the age of 60. He is a non-smoker with the following health data:
- His blood pressure is now 140/80 (mm hg) - this is within a normal range.
- His cholesterol level has dropped to 5 (mM/l) - this is within a normal range.
By using the SCORE chart (see Figure 1), his risk of getting fatal CVD is now 5%, which is much better than the 24% projected if he had continued his former lifestyle. It is important that he continue to follow the healthy lifestyle he has adopted in order to minimise the risk of getting fatal CVD as he gets older.
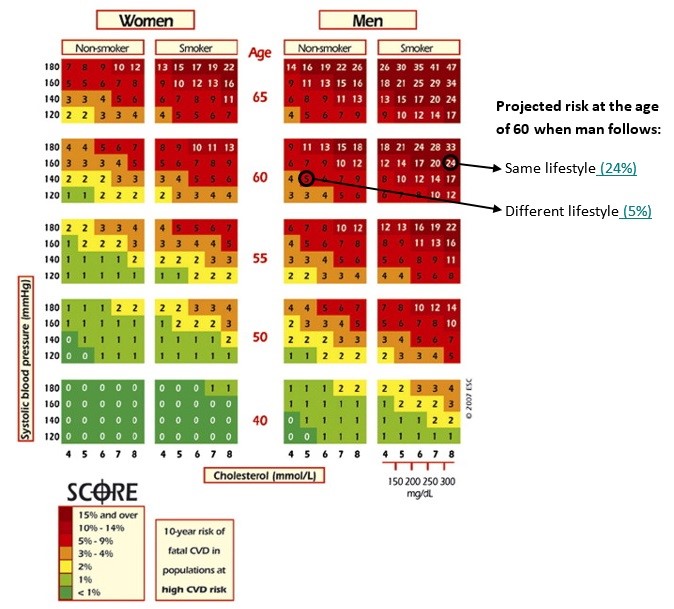
Figure 1: SCORE chart to predict the total risk over a 10 year period for fatal CVD based on gender, age, smoking habits, systolic blood pressure and total cholesterol levels (Source: European Society of Cardiology).
This example shows how the different factors such as gender, age, smoking habits, cholesterol levels and blood pressure influence the risk of a fatal CVD. By using this SCORE chart the doctor can show the patient a visual representation of what may happen over time. The patient and doctor can then work together to develop a plan. If followed, this can lead to significant improvement of the influencing factors, thereby reducing the risk of a fatal CVD.