2. Methodological aspects
| Site: | EUPATI Open Classroom |
| Course: | Epidemiology and Pharmacoepidemiology |
| Book: | 2. Methodological aspects |
| Printed by: | Guest user |
| Date: | Tuesday, 21 July 2026, 6:03 AM |
1. Causation and correlation
(This section is organised in the form of a book, please follow the blue arrows to navigate through the book or by following the navigation panel on the right side of the page.)
As mentioned earlier, central activities of pharmacoepidemiology involve inquiry into the causes of illness or other outcomes of interest, such as medication utilisation (i.e., does a medicine or therapeutic intervention cause a specific outcome?). There may be no association between medicines use and an observed outcome or there may be a non-causal association (correlation), which means the association or relationship between the medicine and outcome might have been observed by chance or because of some systematic error or faulty conclusion.
An understanding of the concept of causation versus correlation is important.
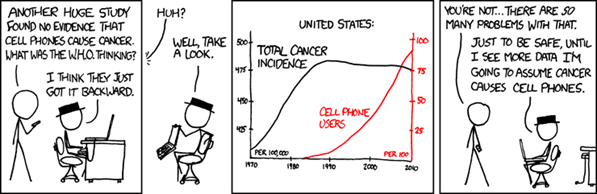
Source: https://xkcd.com/925/
While causation and correlation can exist at the same time, correlation does not imply causation. Causation explicitly applies to cases where action A causes outcome B. On the other hand, correlation is simply a relationship. Action A relates to Action B—but one event doesn’t necessarily cause the other event to happen. We cannot simply assume causation even if we see two events happening, seemingly together, and conclude there is a cause-and-effect relationship where the dependent event is the result of an independent event. There are so many other possibilities for an association, including:
- The opposite is true: B actually causes A.
- The two are correlated, but there’s more to it: A and B are correlated, but they are actually caused by C.
- There’s another variable involved: A does cause B—as long as D happens.
- There is a chain reaction: A causes E, which leads E to cause B (but you only saw that A causes B from your own eyes).
Consider the following:
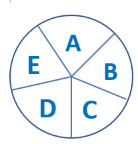
This circle represents a single causal mechanism for an effect. Each letter represents one component cause, which is one element of the causal process. For the effect to occur, all of the component causes must play their part in the process.
When we observe cause and effect, such as the simple action of flipping a switch on a wall to turn on a light, we may think that moving the switch is all it takes to cause the light to turn on. But that is true only if certain other conditions are met:
1) The bulb is still working.
2) The wiring in the walls is intact and makes a circuit.
3) There is electrical current applied to the circuit.
- If all of these conditions are met, flipping the switch makes the light work. Each of the conditions, along with flipping the switch, is an essential component of the causal mechanism, which we refer to as a ‘component cause’. The effect (of turning on the light) can be prevented by removing any one of the component causes. Note that some of the component causes, e.g., wiring in the walls, may have occurred long in the past.
- We can think about causes of diseases in the same way. The diagram of causal components symbolises the elements of a causal mechanism. For an effect to occur, the various components of a causal mechanism must all interact in an intricate process and sequence. The exact nature of the interaction, and the sequence of actions, is left unspecified in the diagram.
1.1. Causality of an epidemiological association
In contrast to experimental designs as used in clinical trials, pharmacoepidemiology researchers often rely on nonexperimental or observational study designs. Thus, pharmacoepidemiology employs complex study designs and statistical analyses to evaluate rather intricate causal relationships between a therapeutic intervention, including medicine exposure, and an outcome and to find the true causal relationships.
However, before causality can be assessed, each study must be evaluated to determine whether its design is appropriate, the study size is adequate and systematic bias (see below, 2.5) has not influenced the observed association. In addition, the magnitude (both in size and frequency) should be sufficiently large. Causality should ideally be supported by evidence from several epidemiological studies in various geographic regions. Supporting toxicological and pharmacological data are also important. Epidemiological data should be interpreted with caution and in the context of other available scientific information.
Guidelines are available to help assess the possible causality of associations observed in epidemiological studies. The following should be considered (after Bradford Hill, 1965[1] and Rothman 1986[2]):
• Biological plausibility. When the association is supported by evidence from clinical research or toxicology about biological behaviour or mechanisms, an inference of causality is strengthened.
• Temporal association. Exposure must precede the disease, and in most epidemiological studies this can be inferred. When exposure and disease are measured simultaneously, it is possible that exposure has been modified by the presence of disease and it may be especially hard to confirm any or the true causal effect.
• Study precision and validity. Individual studies that provide evidence of an association are well designed with an adequate number of study participants (good precision) and well conducted with valid results (i.e., the association is not likely due to systematic bias).
• Strength of association. The larger the relative risk, the less likely the association is to be spurious or due to unidentified confounding. However, a causal association cannot be ruled out simply because a weak association is observed.
• Consistency. Repeated observation of an association under different study conditions supports an inference of causality, but the absence of consistency does not rule out causality.
• Specificity. A putative cause or exposure leads to a specific effect. The presence of specificity argues for causality, but its absence does not rule it out.
• Dose–response relationship. A causal interpretation is more plausible when an epidemiological gradient is found (e.g., higher risk is associated with larger exposures).
• Reversibility or preventability. An observed association leads to some preventive action, and removal of the possible cause leads to a reduction of disease or risk of disease.
[1] Hill, Austin Bradford (1965). "The Environment and Disease: Association or Causation?". Proceedings of the Royal Society of Medicine. 58 (5): 295–300. doi:10.1177/003591576505800503. PMC 1898525. PMID 14283879.
[2] Rothman KJ. Modern epidemiology. Boston: Little, Brown, 1986:299-304.
2. Induction time
Induction time is the time interval between the action of a component cause and the start of disease or change in health status. Each component cause has its own induction time.
There are two ways of looking at induction time. Since the exposure to a potentially harmful agent may need to accumulate to a certain threshold, other factors have to be present before the disease can occur. Accumulation takes a period of time called 'the induction period.' Alternatively, the exposure may be the first event in a series of causal events that must occur for the disease to develop. For example, a syndrome may be the result of a) a susceptible individual's accumulated exposure to a chemical, leading to b) a genetic damage which leads to c) a decrease of a certain neurotransmitter. This process may take months or years. Individual susceptibility varies based on specific biological/ physiological factors[1].
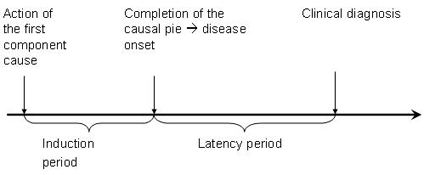
N.B. Although the latency period in this case is defined as the time until clinical diagnosis of a disease, the disease might have been present even with symptoms but may not have been diagnosed.
Examples:
- Short induction time: Some conditions have very short induction times, such as an allergic reaction to eating peanuts that may occur within minutes. However, the predisposing factors for the allergy are other causes for the reaction that may have been present long ago, and therefore have a long induction time.
- Medium induction time: If rabies is not treated quickly after a bite from an infected animal it may develop into symptomatic disease from one to three months after the rabies virus enters the body.
- Longer induction time: It may take years for a person to develop lung cancer when smoking cigarettes.
[1] Adapted from: https://epiville.ccnmtl.columbia.edu/glossary.html#I
4. Measures of effect
Epidemiologic research aims to measure effects by comparing risks or rates.
We measure effects by comparing risks or rates in two or more groups. If smokers have a rate of lung cancer that is 10 times the rate among non-smokers, this is a measure of the effect of smoking on lung cancer.
We can compare either rates or risks by looking at the absolute difference between the rates or risks, or by looking at their relative size (comparison made in the terms one rate or risk over another, e.g. twice as big).
Example: Suppose the risk of a smoker getting lung cancer between 30 and 70 years of age is 8%, and the risk of a non-smoker getting lung cancer between those ages is 1%. The risk difference (absolute effect) over the 40 years is 7%, i.e., by smoking you are increasing your chance of getting lung cancer by 7%. The risk ratio (relative effect) over the same period is eight, smokers are eight times more likely to get lung cancer than non-smokers in this age range.
5. Errors in measurement
There are two main types of error that affect epidemiologic studies, systematic error and random error. Epidemiologists try to reduce both types of error in the design of a study.
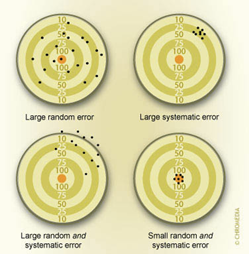
Systematic errors are associated with a flaw in the design of a study or of an instrument used for measurement. Suppose you were using a stopwatch to measure the times for runners in a 100-metre event but the stopwatch you were using was running slow. The times for all the runners that you measured would be incorrect and would underestimate the actual time. This is an example of systematic error, also called bias.
Random errors in the time measurement could occur by holding the stopwatch differently, differences in your reaction time in pressing the stop button, or how you read the time on the watch. Some of these errors will lead to a reading that is too high or too low but on average the readings would not tend to be too high or too low. The effect of these errors would become less