3. Incidence
| Site: | EUPATI Open Classroom |
| Course: | Epidemiology and Pharmacoepidemiology |
| Book: | 3. Incidence |
| Printed by: | Guest user |
| Date: | Tuesday, 21 July 2026, 1:52 PM |
1. Incidence
(This section is organised in the form of a book, please follow the blue arrows to navigate through the book or by following the navigation panel on the right side of the page.)
With short lived illness, like the common cold, incidence and prevalence tend to go hand in hand. It is also possible for a disease to have a high prevalence but low incidence if for example you were to take the case of an infection which is incurable (or long lasting) but does not readily kill, and then develop a highly effective vaccine. The prevalence would still be high due to pre-existing cases, but incidence would be low as the vaccine is preventing new cases from occurring.
For example, HIV is nowadays a treatable infection with a normal life expectancy. This means that with stable numbers of new cases, prevalence numbers will increase. This is illustrated in the following graph.
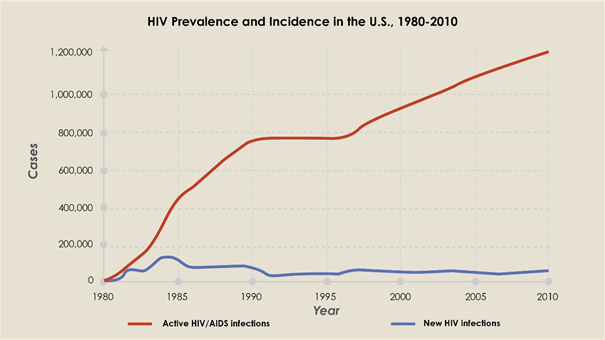
Figure 1: Comparison of the incidence of HIV (the number of new cases reported each year, shown in blue) with the prevalence (the total number of cases observed each year, shown in red) [1] .
[1] Taken from K. Steward https://www.technologynetworks.com/immunology/articles/incidence-vs-prevalence-329073
2. Measurements of incidence
Incidence can be measured as a proportion or as a rate. Measured as a proportion, it quantifies the risk of an occurrence in a given time period. Measured as a rate, it quantifies the number of new cases in a population over time. Thus, to calculate incidence, three elements must be defined: (1) the number of new cases, (2) the population at risk, and (3) the time period.
2.1. Incidence proportion (cumulative incidence)
Incidence proportion is the proportion of an initially disease-free population that develops the disease or experiences a health event during a specified period of time[1]. The denominator of an incidence proportion is the number of persons at the start of the observation period.
For an incidence proportion, the numerator is the number of new cases of a disease or health event that occur during a given time period, while the denominator is the total specified population at risk during the defined study period. To accurately measure incidence proportion, all individuals at risk for the health event under study must be followed during the entire study period. Because complete follow-up is required to directly compute incidence proportion, it is usually only calculated for studies with a short follow-up period.
[1] Resource available at: Lesson 3: Measures of Risk | CDC Archive
2.2. Incidence proportion as risk
A useful way to think about incidence proportion is that it is the probability of developing disease over a stated period of time; as such, it is an estimate of risk. Since all of the persons with new cases of disease are also represented in the denominator, a risk is also a proportion.
Risk is a measure that is usually easily understood. When risk is misunderstood, it is often because the ‘specified time’ over which risk is measured is not expressed.
Examples of risk include:
- In a town of 100 people, 20 of them develop influenza during the influenza season. The risk is 20 out of 100 or 20% to develop influenza during that season.
- In a population of 10,000 males at 60 years of age, 900 of them will develop heart disease during the next 10 years. In this population, the risk is 9% to develop heart disease during the 10 year period.
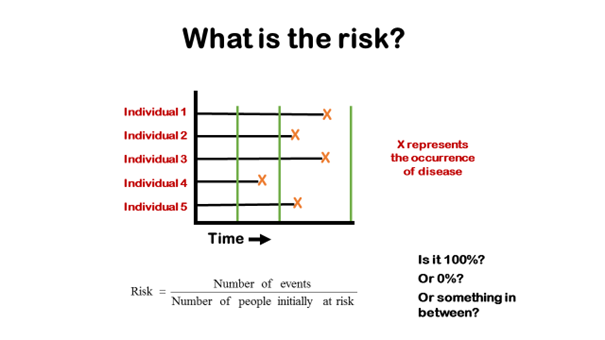
This diagram shows how the calculation of risk depends on the time period over which it is measured. The orange crosses indicate the occurrence of disease in five people who are being followed. The green lines indicate different times at which the follow-up might stop. If the follow-up time ended at the first green line the risk would be zero, because no cases occurred before that time. If the trial continued to the second green line, the risk would be 20% (one case in five people), and it would be 100% if the follow-up continued to the third green line.
Interpreting a risk
It is difficult, if not impossible, to interpret a statement such as this (taken from a newspaper article):
‘Men at age 60 have a 7% risk of a heart attack.’
The problem with this particular statement is that there is no time period mentioned. A risk of 7% would be very high if it occurred during one year, but it would be low if it referred to a 30-year period.
It is common to see risk measures reported without a time period, but such measures cannot be interpreted. Sometimes the time measure is implied, but vague. For example, one might see a statement such as: ‘The risk of dying from open-heart surgery is 2%.’ But does this refer to the risk during the first day following surgery, the first week, or longer? The value of the risk would be different for each of those time intervals.
Therefore, the incidence proportion (also called cumulative incidence) must specify a time period as an integral part of the result reported.
2.3. Incidence rate
Incidence rate or person-time rate is a measure of incidence that incorporates time directly into the denominator, i.e., a measure of the number of new cases ("incidence") per unit of time ("rate").
Similar to the incidence proportion the incidence rate numerator is the number of new cases identified during the period of observation. The denominator, however, is the total person-time, or the amount of time that all at-risk persons were in the study. It is the sum of the time each person was observed, totalled for all persons and therefore actually a combination of the number of people and the amount of time. Thus, the incidence rate is the ratio of the number of new cases to the total time the population is at risk of disease. An example for how this can be calculated is given in the next section.
3. Calculating incidence
The two
ways of measuring incidence, incidence proportion (cumulative incidence) and
incidence rate, both share the same numerator: the number of new cases that
developed over a period of observation.
They
are different in how they address the dimension of time:
- Incidence proportion (cumulative incidence) is the proportion of people who develop the outcome of interest during a specified period of time.
- Incidence rate is a true rate whose denominator is the total of the group's individual times "at risk" (person-time).
Depending on how incidence is expressed, two different equations will be employed.
3.1. Incidence proportion (Cumulative incidence)
Incidence proportion is worked out by dividing the number of new cases of disease or health event by a population at risk over a specified time period.
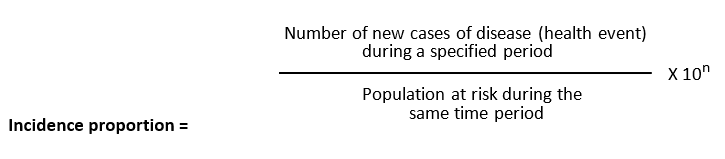
The relevant time period must be stated.
The value of 10n is set at 100 (102) to give the percentage but can also be different as mentioned above (see 2.2.1).
Note: Incidence proportion does not take into account:
- dropouts (loss to follow-up) during the observation period.
- When people developed the outcome.
3.2. Incidence rate
An incidence rate can be calculated only when there is ongoing follow-up of subjects who are at risk at the beginning of an observation period. One can calculate each individual's "time at risk" from when health events of interest occur and approximately when losses to follow up occur. The time at risk for each subject is the time from the beginning of their observation until one of three “endpoints” are reached:
- An individual develops the health event of interest (thus becoming no longer "at risk")
- An individual becomes lost to follow up or dies. If this occurs, we count the time that they were observed to be disease-free, but they stop contributing "time at risk".
- The study ends after the specified time period.
One then adds up the total "time at risk" among all persons in the group (i.e., total person-time) and uses this as the denominator. Therefore, person-time takes into account the number of people in the group and their time at risk.
Then the equation for calculating incidence rate reads:
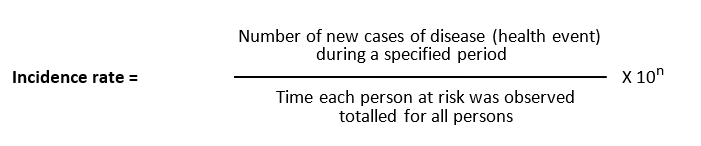
Time is an inherent part of the calculated incidence rate, but one should still state the time period over which it was calculated, e.g., "The incidence rate was 163 per 100,000 person-years from 2020 to 2021."; however, to say "The incidence rate was 163 new cases of a health event/disease per 100,000 persons from 2020 to 2021” is easier to understand (see points to consider chapter 4 in this book).
3.3. Calculating Incidence - example
Look at the following table describing a 5-year study of a population of five patients. We are following these five healthy patients, as we would like to analyse the incidence of disease ‘A’.
|
|
Year 1 |
Year 2 |
Year 3 |
Year 4 |
Year 5 |
|
Patient 1 |
Healthy |
Healthy |
Healthy |
No data |
No data |
|
Patient 2 |
Healthy |
‘A’ |
Healthy |
Healthy |
Healthy |
|
Patient 3 |
Healthy |
Healthy |
Healthy |
Healthy |
Healthy |
|
Patient 4 |
Healthy |
Healthy |
Healthy |
‘A’ |
Healthy |
|
Patient 5 |
Healthy |
Died |
|
|
|
Patient 1 was followed for three years and after his third annual check he did not show up any more. We do not know why. He did not get the disease ‘A’ in the first three years and we do not know what happened afterwards. We will keep him in our records with ‘3 person-years at risk’.
Patient 2 was followed for five years and got sick in the second year but recovered. How many years at risk will we include? One or four? This actually depends on the type of the disease. We assume in our example that you could get the disease more than once in your lifetime, so we would include him with ‘4 person-years at risk’.
Patient 3 has been followed for five years and never got the disease; he was ‘5 person-years at risk’.
Patient 4 has got the disease in the fourth year. We will include four years at risk into our calculation as we said earlier that you could get the disease in this example more than once.
Patient 5 was followed for one year and died (of an unknown cause). We do not know any details regarding disease ‘A’. Only the one year in which he was at risk (i.e. healthy) is added to the cumulative total of person-years at risk.
Incidence proportion (cumulative incidence): We found two new cases in a population of five
persons, so we could calculate:
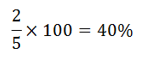
We might speak of an incidence of 40 new cases per 100 persons over 5 years
Incidence rate: We can also calculate the incidence using healthy years (at risk) instead of total population. In this case we divide the number of new cases (two cases) by the total of the healthy years where persons were at risk to the disease (17 years):
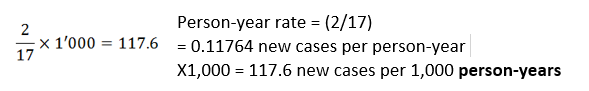
The result of 117.6 would be read as ‘117.6 new cases per 1,000 person-years’
or “The incidence rate was 117.6 new cases per 1000 persons per year from start date to end date”.
4. Points to consider
- Incidence rate measures are useful when describing how quickly disease occurs in a population. This information can be used to monitor the effectiveness of vaccination schemes or changes in the applied preventative measures to see if they cause a knock-on reduction in disease incidence rate. Equally, if incidence rates rise, it can act as a warning that existing preventative measures are failing and therefore guide remedial action.
- Since for incidence rate person-time is calculated for each individual it can include persons entering and leaving study populations, whereas incidence proportion assumes that those individuals were disease-free; therefore, incidence rate generally is more accurate than incidence proportion for long-term studies.
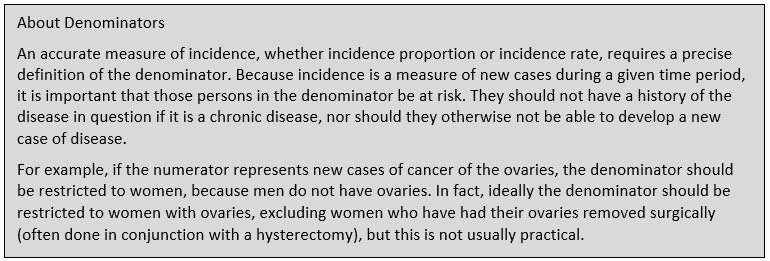
- ·An accurate measure of incidence, whether incidence proportion or incidence rate, requires a precise definition of the denominator. The denominator accounts for study participants who are lost to follow-up or who die during the study period. Because incidence is a measure of new cases during a given time period, it is important that those persons in the denominator be at risk (see text box on denominators earlier in the lesson).
- An additional consideration for the use of incidence rate is that it assumes a constant probability of disease, which may not reflect actual probability, particularly for conditions whose risk increases with age.
- When communicating about incidence rates, refrain from an epidemiologist’s jargon. Reporting the incidence rate of, for example, stroke in country X for 2010 as 117 per 100,000 person-years, most people will not understand. To convert this jargon to something understandable, simply replace “person-years” with “persons per year” and convert the numbers to a plausible format. Reporting the results as 1,17 new cases of stroke per 1,000 persons per year sounds like plain language rather than jargon.
5. Incidence proportion (cumulative incidence) versus Incidence rate
Cumulative incidence and incidence rate are both useful, depending on the circumstance. The table below summarizes their appropriate use and their strengths and limitations.
|
|
Incidence Rate |
|
|
Strengths |
|
|
|
Limitations |
|
|
|
Appropriate Use |
|
|