Statistical Analysis Plan
| Site: | EUPATI Open Classroom |
| Course: | Statistics |
| Book: | Statistical Analysis Plan |
| Printed by: | Guest user |
| Date: | Wednesday, 22 July 2026, 7:34 AM |
1. What is the Statistical Analysis Plan (SAP)?
(This section is organised in the form of a book, please follow the blue arrows to navigate through the book or by following the navigation panel on the right side of the page.)
Several clinical trial documents are prepared to support the trial design, data collection, analysis and reporting. The statistical analysis plan (SAP) is one of these documents. The SAP provides details on the scope of planned analyses, population definitions and methodology. The SAP is crucial for guiding the data analyses and should therefore be created prior to such data analyses. The SAP is often integrated in the study protocol and must be submitted with the clinical trial application before the trial begins.
The SAP is submitted to Regulatory Authorities also as part of the submission package. The SAP is also an appendix of the clinical study report. The SAP is stored in the trial master file and it is used during audits to check if statistical analyses are performed as planned. The role of the SAP is explained in the International Council for Harmonisation (ICH) E9 guideline 'Statistical principles for clinical trials'.
For each trial, one must specify upfront the planned statistical analysis in the SAP. This should include:
- Primary and secondary endpoints.
- Analysis methods.
- Primary) analysis set.
- Pre-defined comparisons and significance levels.
- Exploratory analyses.
- Trial maturity.
2. SAP Contents
The following are the main elements described in the SAP:
- Trial primary and secondary endpoints
- Survival curve
- Analysis methods
- Interim analysis
2.1. Trial Primary and Secondary Endpoints
The primary endpoint of a clinical trial must correspond to the scientific objective of the trial. Both primary and secondary endpoints may be made up by several endpoints called a ’family of endpoints’. Secondary endpoints should provide supportive information
about a medicine’s effect on the primary endpoint or demonstrate additional effects on the disease or condition. Endpoints can be measured objectively (blood pressure, weight, survival time) or indicated subjectively by patients or clinicians on standard
score sets (e.g. level of pain, psoriasis area evaluation, outcome reports). The trial endpoints can be of several types: Continuous, binary or time-to-event endpoints.
-
Continuous:
- Is made up of measured data (e.g. height, weight).
- Examples of continuous endpoints are blood pressure measurements or body temperature.
- Binary:
- Response Rate – how often a response occurs.
- Absolute frequency – how many times a response occurs.
- Relative frequency – for what percentage of participants does a response occur?
- Time-to-event (TTE):
- Time to progression (TTP): time from randomisation to progression of disease.
- Overall survival (OS): time from randomisation to death from any cause.
- ‘Event’ free survival (EFS): time from randomisation to either ‘event’ or death from any cause.
- ‘Event’ free interval (EFI): time from randomisation to either ‘event’ or death related to the disease evolution or treatment.*
2.2. Survival Curve
- The survival probability = probability of surviving beyond a specified time point.
- Estimated as:
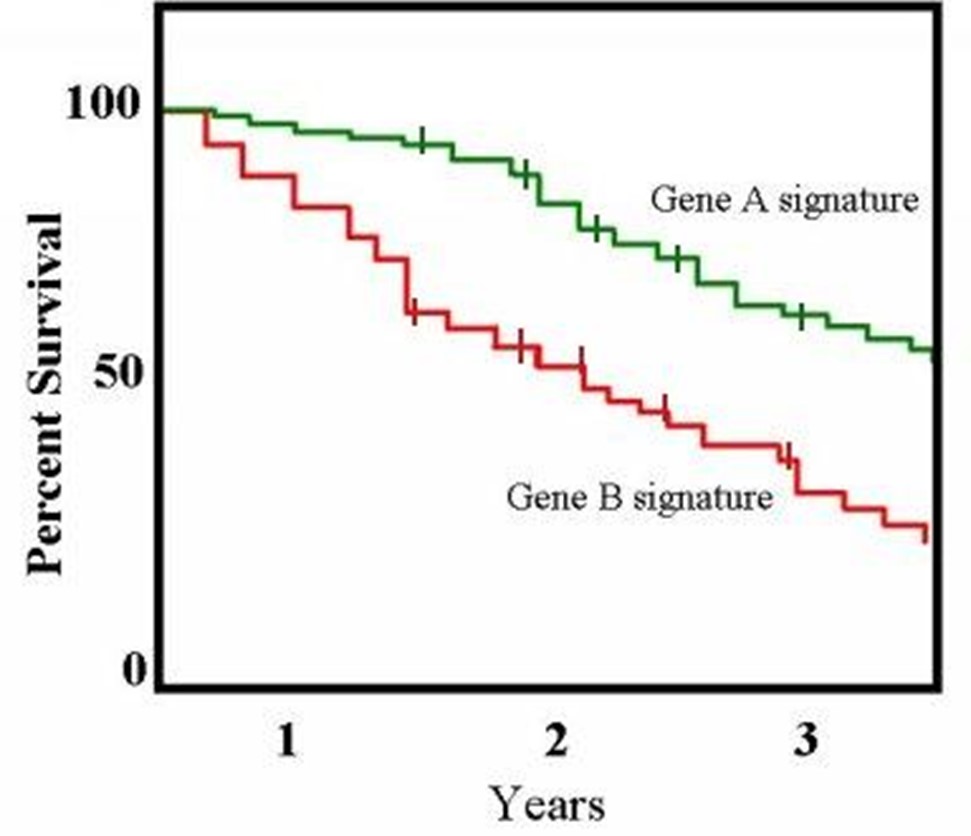
Figure 1: Example of a Kaplan-Meier survival curve.
(Taken from: http://openi.nlm.nih.gov/detailedresult.php?img=2768180_zdb0110958890002&req=4)
2.3. Analysis Methods
The SAP describes which statistical methods are to be used to analyse the data. The following aspects need to be covered where applicable:
- Main/primary analysis: to obtain the main clinical trial results on the specified trial endpoint(s).
- Supportive/sensitivity analyses: analyses on different sets of patients or using different analysis techniques than for the main analysis. These are used to confirm the conclusions of the main analysis.
- Exploratory analyses: all other analyses e.g. further data exploration.
(Primary) Analysis Set
This section is designed to identify which of the recruited patients are to be included in the different analyses:
- Intention-to-treat (ITT).
- Per protocol (PP).
- Safety population.
Case study: Consider the setting of a clinical trial comparing a new experimental treatment to the standard of care. However, some patients taking the experimental treatment are too sick, because of side effects, to go to the next visit
within the allotted time. A possible approach would be to include only patients with complete follow-up (all the visits), so to exclude these patients with incomplete follow-up (missing visits) from the analysis. However, by doing so, one selects
a sub-group of patients whom, by definition, will present an artificially positive picture of the treatment under investigation.
One potential solution to this problem is a statistical concept called intention-to-treat (ITT) analysis. ITT analysis includes every randomised patient and will consider that every patient received the treatment assigned by the randomisation. As such,
ITT analyses maintain the balance of patients' baseline characteristics between the different trial arms obtained from the randomisation. ‘Protocol deviations’ such as non-compliance to the assigned treatment (schedule, dosing, etc.) are part of daily
practice. Therefore, treatment-effect estimates obtained from ITT analysis are considered to be more representative of the actual benefit of a new treatment in real life.
Per protocol analysis (PP): This analysis population is restricted to the participants who strictly fulfil the protocol requirements in terms of patient eligibility criteria, treatment compliance and outcome assessment. PP analyses usually
exclude patients who have not had at least one dose of the allocated treatment, all ineligible patients, patients with major protocol violations and sometimes patients with incomplete data for the targeted endpoint. A PP analysis is useful in determining
the biological effect of a treatment. However, the value of the treatment may not be shown in a real-life situation since PP analysis is restricted to a highly selected patient subgroup corresponding to an ‘ideal’ setting.
Safety population: All randomised patients who have started their allocated treatment (at least one dose of the trial medicine). This analysis population is often used to describe the safety profile of a treatment.
Sub-group Analysis
This section of the SAP aims to detail which sub-group analyses will be performed. Controlled clinical trials are designed to investigate the effect of a treatment in a given population of patients. Sub-group analyses involve splitting the trial participants
into sub-groups. This could be based on:
- demographic characteristics (e.g. sex, age)
- baseline characteristics (e.g. a specific genomic profile)
- use of concomitant therapy.
Findings from sub-group analyses might be misleading for several different reasons. Firstly, sub-group analyses are observational (sub-groups are defined on observed patients’ characteristics) and not based on randomised comparisons. The ‘hindsight bias’,
also known as the ‘I-knew-it-all-along’ bias, is the inclination to see events that have already occurred as being more predictable than they were before they took place. This is why sub-group analysis should be pre-planned.
Even when pre-planned, they are still open to criticism of ‘multiplicity’. When multiple sub-group analyses are performed, the risk of finding a false positive result (i.e. a type I error) increases with the number of sub-group comparisons. Multiplicity
issues are in general related to repeated ‘looks’ at the same data set but in different ways until something ‘statistically significant’ emerges. With the wealth of data sometimes obtained, all signals should be considered carefully. Researchers must
be cautious about possible over-interpretation. Techniques exist to protect against multiplicity, but they mostly require stronger evidence for statistical significance to control the overall type I error of the analysis. Here is a list of some of
the common methods: (see also FDA Guidance on complex trial results).
2.4. Interim Analysis
aim is to detect eventual trends with regard to the safety and/or efficacy of the tested treatment before the primary analysis. If the early data show a clear benefit with the tested treatment, it is unethical to continue exposing patients to less effective standard therapy. Similarly, if there is clearly no benefit with the tested treatment, the protocol should be modified or the trial stopped.
The SAP should describe:
- The planned interim analysis, including when it will take place.
- How the unblinding of data will be handled (in blinded trials).
- The scope of decisions on the trial conduct and on which criteria they will be based.
3. Trial Maturity
Sufficient data need to be available in order to perform the planned statistical analysis. Rules for assessing the so-called maturity of the data need to be specified upfront in the SAP. Depending on the type of endpoint, this may refer to a certain number of patients with a pre-specified follow-up time (e.g. one year after the last patient was registered) or when the pre-specified number of events needed for the primary outcome analysis is reached, as is often done in the case of a time-to-event endpoint.4. Unit Summary
The statistical analysis plan (SAP) is a crucial trial document describing the planned analysis of clinical trial data. The SAP provides the researchers with relevant information and details on the scope of the primary, supportive and interim analyses, population definitions, and methodology.5. Further Reading
- Schulz KF, Grimes DA. Multiplicity in randomised trials II: sub-group and interim analyses. The Lancet May 2005, 365: 1591-95.
- Lagakos SW. The challenge of sub-group analyses – reporting without distorting. N Engl J Med 354:16 April 2006. 1667-9.
- Jennison, C. and Turnball, B.W (2000) Group Sequential Methods With Applications to Clinical Trials. Chapman & Hall/CRC Interdisciplinary Statistics
- Sydes MR, Langley RE. Potential pitfalls in the design and reporting of clinical trials. Lancet Oncol. 2010 Jul;11(7):694-700. doi: 10.1016/S1470-2045(10)70041-3