Incidence & Prevalence
| Stránky: | EUPATI Open Classroom |
| Kurz: | Statistics |
| Kniha: | Incidence & Prevalence |
| Vytiskl(a): | Nepřihlášený host |
| Datum: | středa, 22. července 2026, 10.03 |
1. Prevalence & Incidence: Definitions
Definition of Prevalence (Harvard School of Public Health)
(This section is organised in the form of a book, please follow the blue arrows to navigate through the book or by following the navigation panel on the right side of the page.)
Definition of Incidence (Harvard School of Public Health)
2. Understanding Epidemiologic Concepts
- How many are affected by such events?
- Is the risk increasing or decreasing?
- What is the relevance of the problem?
- How could it be prevented?
2.1. Definitions
- Health event: A particular disease, injury, other health condition or attribute.
- Population: The total number of persons living in a particular place (e.g. a town or country), or the total number of persons in a particular group (e.g. with the same job or educational background).
- Prevalence: The total number of cases of a health event in a specified population.
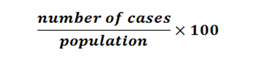
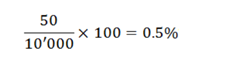
- Prevalence rate: The proportion of a population that has a health event:
- at a specified point in time (e.g. on a certain date) – ‘point prevalence’, or
- during a specified period (e.g. over 12 months) – ‘period prevalence’.
- Proportion: A ratio between health events occurring and population, often shown as a fraction or percentage. For example, the number of people who have a disease compared with the total number of people studied.
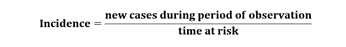
- Incidence: The number of new cases of a health event during a given period in a specified population.
- Incidence rate: The frequency with which new health events occur, related to a particular time frame (e.g. the number of new cases per year). Incidence rate is worked out by dividing the number of new cases over a specified period either by:
- the average population (usually ‘mid period’ - the population half-way through the period being looked at), or
- ‘person-time’ - a measure of the number of persons at risk and the time they were at risk.
2.2. How Many People Are Affected?
|
|
Country A |
Country B |
|
Persons affected by a certain health event |
10.000 |
20.000 |
|
Total population of the country |
20.000 |
200.000 |

2.3. Example - Hair Colour
3. Prevalence
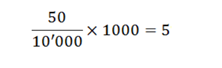
Rather than expressing prevalence as a percentage, we can describe it as the number of people affected in a standard sized population, for example 1,000 people. So instead we would calculate:
- How many people can you see there? That number is your population.
- How many people share a certain feature (e.g. same hair colour)? This number is used to calculate prevalence.
3.1. Calculating Prevalence
- Point prevalence: the number of cases of a health event at a certain time. For example, in a survey you would be asked if you are currently smoking.
- Period prevalence: the number of cases of a health event in reference to a time period, often 12 months. For example, in a survey you would be asked if you have smoked during the past 12 months.
- Lifetime prevalence: the number of cases of the health event in reference to the total lifetime. For example, in a survey, you would be asked if you have ever smoked.
4. Incidence

Often
you can read about the incidence of a heath event as a certain number of cases
per 100 or 1,000 person-years.
4.1. Calculating Incidence
|
|
Year 1 |
Year 2 |
Year 3 |
Year 4 |
Year 5 |
|
Patient 1 |
Healthy |
Healthy |
Healthy |
No data |
No data |
|
Patient 2 |
Healthy |
‘A’ |
Healthy |
Healthy |
Healthy |
|
Patient 3 |
Healthy |
Healthy |
Healthy |
Healthy |
Healthy |
|
Patient 4 |
Healthy |
Healthy |
Healthy |
‘A’ |
Healthy |
|
Patient 5 |
Healthy |
Died |
|
|
|


The result of 117.6 would be read as ‘117.6 new cases per 1,000 person-years’.